


Who is the best overall performer in ATP? – Data analysis based on TDI


In the previous six articles, we analyzed ATP players' serve, return, forehand, backhand, offensive, and defensive quality based on the TDI indicator system.
Today, let's focus on overall performance, using the overall performance evaluation metrics within the TDI system to measure and analyze who is the best overall performer among ATP players. This article is the seventh and final piece of this series.
1. What metrics does TDI set for overall performance, and how do they differ from traditional metrics?
In tennis, excellence in a single technique alone is insufficient to achieve championship success. Only when all techniques are balanced, synergized, and coordinated can a player maintain stable competitiveness throughout a long season or even an entire career. For general spectators, evaluating a player's overall performance often relies solely on "tournament win rate" and "number of titles," or "world ranking," etc., but they cannot clearly articulate "where his overall strengths lie," "how his various techniques cooperate to form competitiveness," or "why he can maintain stable performance across different surfaces and against different opponents."
The core value of TDI's overall performance metrics lies in breaking the limitation of "isolated evaluation of individual techniques." It integrates six individual technical indicators—serve, return, forehand, backhand, offense, and defense—through scientific weight allocation to form a comprehensive evaluation of a player's overall capability. This allows us to see both a player's individual strengths and the synergistic effects of various techniques, truly understanding the core logic behind "why top players are top"—as per the core philosophy of the TDI system, it's not just about evaluating "how strong a single technique is," but also about evaluating "how optimal the overall coordination is."

2. Overall PerformanceThree Major Categories of Core Metrics, Covering"Individual Integration – Synergistic Effect – Overall Outcome"
The first category is the Overall Quality Score (OQS), which is the core foundation of the overall performance metrics. Essentially, it is the "weighted summation of the six individual quality indicators," with a scoring range of 0-10. A higher score indicates higher overall quality and better synergy among the player's various techniques.
It is primarily derived from the weighted calculation of the total scores of the six individual quality metrics (Serve SSQ, Return RSQ, Forehand FSQ, Backhand BSQ, Offensive OSQ, Defensive DSQ) with different weights. The weight allocation aligns with the actual logic of tennis matches (offense and forehand have the highest weights, followed by serve, return, backhand, with defense having a slightly lower weight). Additionally, it incorporates personalized calibration based on the player's technical style—for example, offensive players (like Alcaraz) have their offensive weight appropriately increased, while defensive players have their defensive weight adjusted accordingly, ensuring evaluation accuracy. Its calculation logic resembles the weighted summation method in comprehensive evaluation, achieving a comprehensive measurement of overall technical quality through scientifically allocated individual weights.
Furthermore, the Overall Quality Score includes one core auxiliary dimension: Technical Balance (0-10 points), which measures the disparity among the six individual techniques. A higher score indicates more balanced individual techniques with no obvious weaknesses, preventing situations where "one technique is top-notch while others lag" from affecting the overall evaluation.
The second category is Overall Efficiency Metrics, which are "result-oriented" indicators presented as percentages or specific values. Their core function is to examine whether overall quality translates into actual match outcomes, forming a linkage with the Overall Quality Score to explain "why some players have high technical quality across metrics but low match win rates."
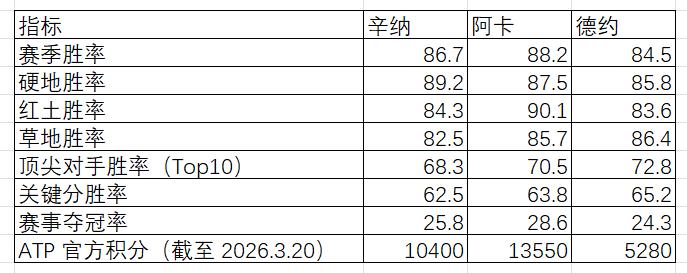
There are five core metrics in this category, as follows: (1) Season Win Rate: The winning proportion in tournaments participated in over the past 52 weeks; higher indicates more stable overall performance. (2) Hard Court/Clay Court/Grass Court Win Rate: Winning proportions on specific surfaces, reflecting the player's surface adaptability. (3) Win Rate vs. Top Opponents: Winning proportion against world top-10 players, reflecting the player's hard strength. (4) Key Point Win Rate: Winning proportion in crucial point scenarios such as game points, set points, match points, reflecting overall stability under pressure. (5) Tournament Title Rate: Proportion of tournaments won among those participated in over the past 52 weeks, reflecting the player's championship competitiveness (combined with ATP official ranking points to further corroborate overall performance).
The third category is Overall Tactical Adaptability Metrics, which serve as the bridge connecting overall quality and overall efficiency. The core focus is on how a player's various techniques synergize and adapt to different scenarios, explaining why, with similar overall quality, some players can maintain stable performance across different surfaces and against different opponents.
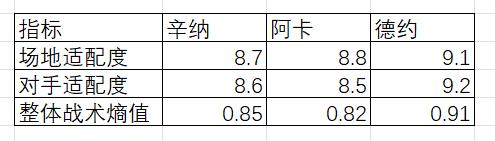
This category comprises three core metrics, meticulously aligned with the TDI system's core logic of "viewing strategy": (1) Surface Adaptability (0-10 points): Measures the consistency of a player's performance on hard court, clay court, and grass court; higher scores indicate stronger surface adaptability with no obvious surface weaknesses. (2) Opponent Adaptability (0-10 points): Measures the consistency of a player's performance against opponents of different styles (offensive, defensive, balanced); higher scores indicate stronger ability to handle diverse opponents. (3) Overall Entropy (0-1): Measures the unpredictability of a player's overall tactical choices, calculated by aggregating the tactical entropy values of the six individual techniques; higher entropy indicates more overall tactical variations, making it harder for opponents to prepare specifically.
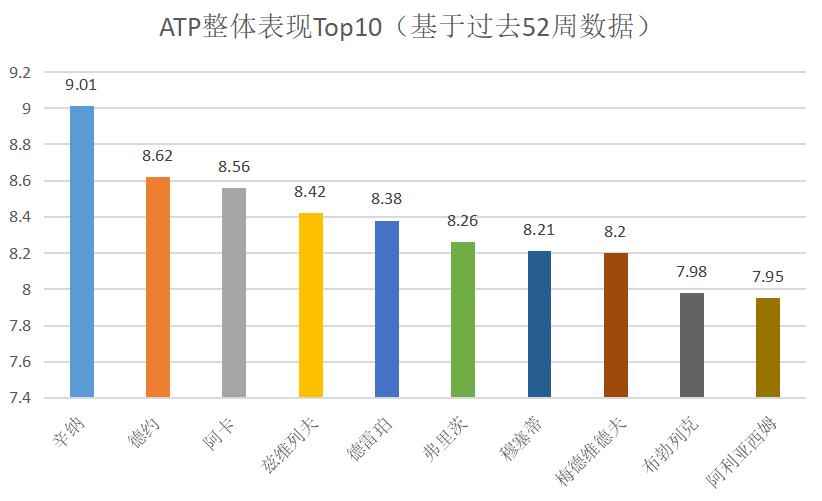
Based on the above three major categories of metrics, ATP has listed the Top 10 overall performance rankings over the past 52 weeks, as shown in the figure below.
3. Comparative Analysis of Offensive Quality Metrics for Sinner, Alcaraz, and Djokovic
Combining ATP official public data from the past 52 weeks, we again take Sinner, Djokovic, and Alcaraz as examples to compare their TDI overall evaluation metrics. This allows us to intuitively understand the role of TDI overall evaluation metrics and clearly see the differences in the overall styles of the three players.
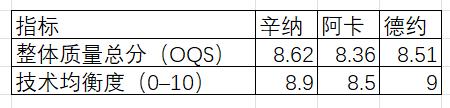
1. Overall Quality Metrics
2. Overall Efficiency Metrics
3. Overall Tactical Adaptability Metrics
Through the above three major categories of metrics, aided by AI, we can analyze the overall stylistic characteristics of the three players.
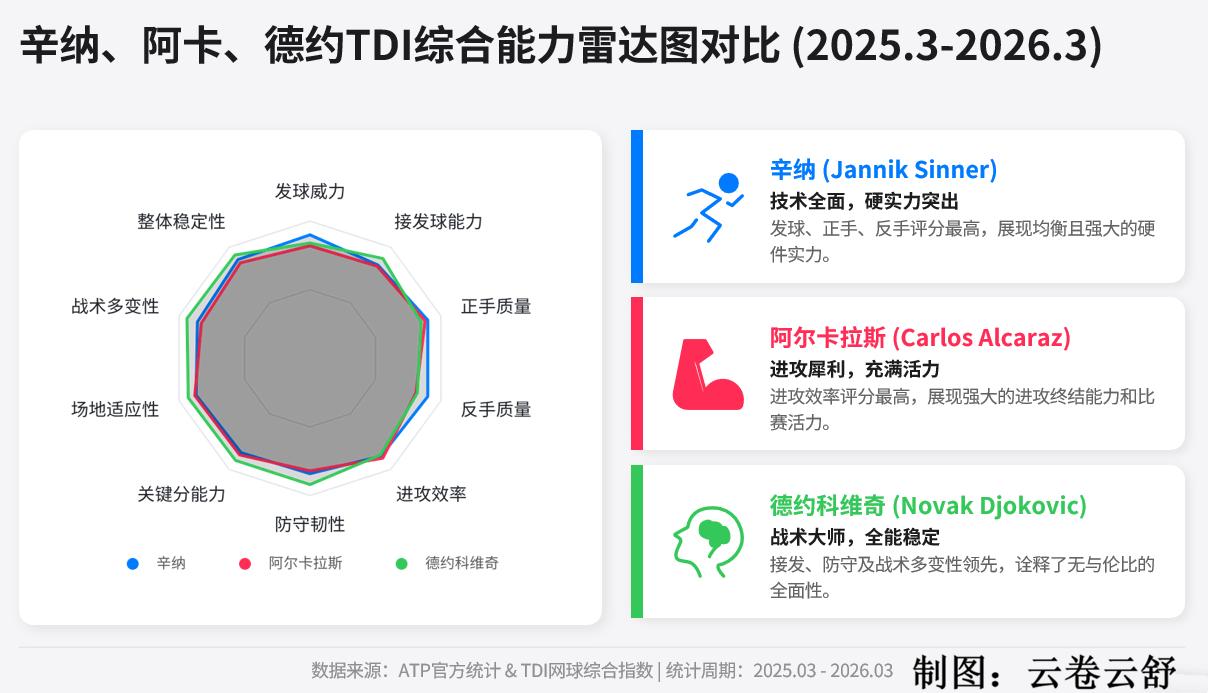
(1)Sinner: Most balanced individual quality, top overall quality, strong dominance on hard court, no obvious weaknesses, stable output type.
(2)Alcaraz: Highest season win rate, title rate, clay efficiency, strongest offensive finishing ability, powerful and efficient type.
(3)Djokovic: Highest technical balance, surface/opponent adaptability, key point win rate, tactical entropy, all-round stable type.
To help readers observe more clearly and intuitively the TDI comprehensive capabilities of Sinner, Alcaraz, and Djokovic, I have created a radar chart comparison and included key characteristic analysis, as shown in the figure below.
(Source: Tennis Home Author: Yun Juan Yun Shu)

 Links
Links
 Contact
Address:UNIT 1804 SOUTH BANK TOWER, 55 UPPER GROUND,LONDON ENGLAND SE1 9E
Number:+85259695367
E-mali:[email protected]
 App
App